Free Business Intelligence Software- Friends, Business Intelligence (BI) software is a powerful tool that can help businesses collect, analyze, and visualize data, so that they can make better decisions and improve their performance. However, not all BI software is affordable or easy to use. Some BI solutions may require a heavy investment, a steep learning curve, or a complex installation process.
Luckily, there are some free BI software options available that can provide many of the same features and benefits without breaking the bank or requiring extensive technical skills. In this blog post, we will review the top 7 free BI software in 2024, based on our research and analysis of their features, functionality, and user reviews.
What is Free BI Software?
Before we dive into the list of the best free BI software, let’s clarify what we mean by “free”. Free BI software is any software that does not charge a fee to use its basic or core features. However, free BI software may have some limitations or restrictions, such as:
- – Data storage or processing capacity
- – Number of users or projects
- – Access to advanced features or integrations
- – Customer support or training
- – Data security or privacy
Therefore, free BI software may not be suitable for every business or use case. You should always evaluate your business needs and goals, and compare the advantages and disadvantages of different free BI software options before choosing one first.
Top 7 Free BI Software in 2024
Here are the top 7 free BI software in 2024, in no order:
1. Tableau Public
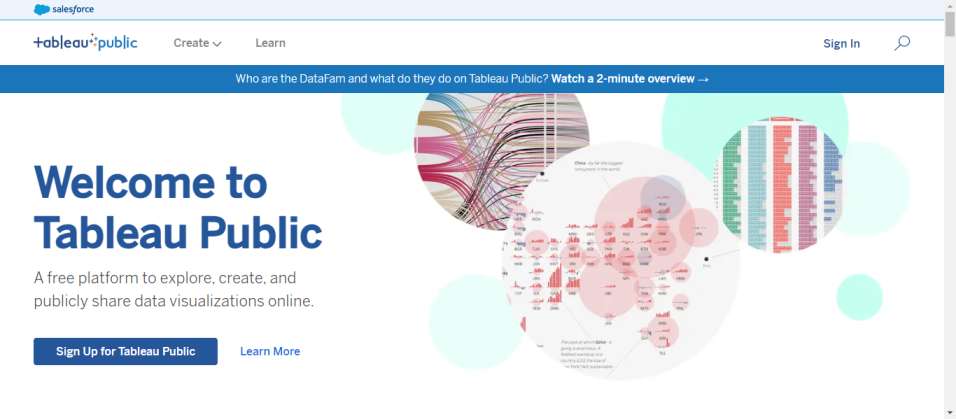
Tableau Public is a web-based BI platform that allows anyone to create and share interactive data visualizations and dashboards online. Tableau Public is free to use, but it requires users to save their workbooks and data sources on a Tableau server, which is publicly accessible. Users can get 10 GB of storage and 15 million rows per workbook. Tableau Public is ideal for freelancers, consultants, students, teachers, journalists, and anyone who wants to showcase their data skills and portfolio online.
Some of the key features of Tableau Public are:
- Data Interpreter: A tool that helps users organize and clean their data for analysis.
- VisiQL: A patented language that translates user actions into data queries and visualizations without the need for coding.
- Show Me: A feature that suggests and displays the best charts and graphs.
- Reporting: A feature that enables users to create dashboards with multiple interactive worksheets.
- Data Connectors: A feature that allows users to connect to different data sources.
2. Zoho Analytics
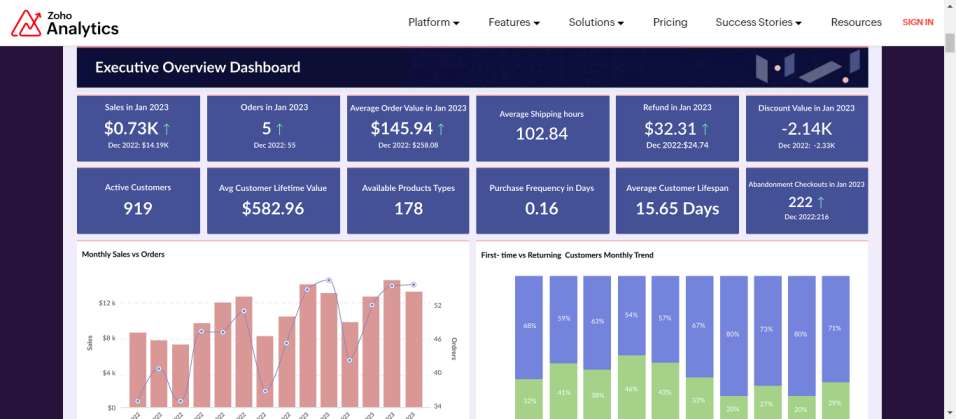
Zoho Analytics is a cloud-based BI and analytics platform that helps users create deep reports and dashboards from their data. Zoho Analytics offers a free plan with 2 users and 10,000 rows of data per month. Users can also access 100+ ready-made reports and dashboards, and 30+ data connectors. Zoho Analytics is suitable for small and medium-sized businesses that need a simple and affordable BI solution.
Some of the key features of Zoho Analytics are:
- Drag-and-drop interface: A user-friendly interface that lets users create reports and dashboards by dragging and dropping data fields, charts, widgets, and filters.
- Zia: An AI-enabled assistant that can answer natural language inquiries, generate charts and insights, and provide suggestions and tips.
- Data blending: A feature that enables users to create cross-functional reports and dashboards by combining data from different sources.
- Data Alerts: A feature that allows users to set up and receive notifications when certain conditions or rates are met in their data.
- Collaboration: A feature that enables users to share their reports and dashboards, comment, and collaborate with their team members or clients.
3. Power BI
Power BI is a popular BI and analytics platform from Microsoft that helps users connect, analyze, and visualize data from various sources. Power BI offers a free plan supporting 1 GB data per day per user and 10 GB data storage per user. Users can also access hundreds of data connectors, templates, and views.
Power BI is ideal for businesses that use Microsoft products, such as Excel, SharePoint, Dynamics, and Azure.
Some of the key features of Power BI are:
- Power Query: A tool that helps users transform and shape their data by applying various operations like filtering, merging, pivoting, aggregating.
- Power Pivot: A tool that helps create and manage data models by defining relationships, ranges, parameters, and calculations.
- Power View: A tool that helps create interactive reports and dashboards using various charts, maps, slicers, and tiles.
- Power Map: A tool that helps users create 3D geographic visualizations and animations from their data.
- Power BI Desktop: A desktop application that allows users to create reports and dashboards and publish them to the Power BI service.
4. Qlik
QlikView is a BI and analytics platform that helps users discover insights and insights from their data. QlikView offers a free personal edition that allows users to create QlikView documents and use them on their local computer, but cannot share with others.
Users can also access several data connectors, extensions, and templates. QlikView is suitable for advanced users who need a powerful and flexible BI solution.
Some of the key features of QlikView are:
-Associative Engine: A patented technology that allows users to explore and analyze data from any angle, without any predefined queries or data models.
- In-memory processing: A technology that enables users to load and manipulate large amounts of data in memory, leading to faster performance and scalability.
- Scripting: A feature that lets users write custom scripts to load, transform, and manipulate data from a variety of sources and formats.
- Data Visualization: A feature that lets users create rich and interactive data visualizations such as charts, tables, gauges, maps.
- Data Storytelling: A feature that lets users create and present data stories with snapshots, annotations, and effects.
5. Looker Studio
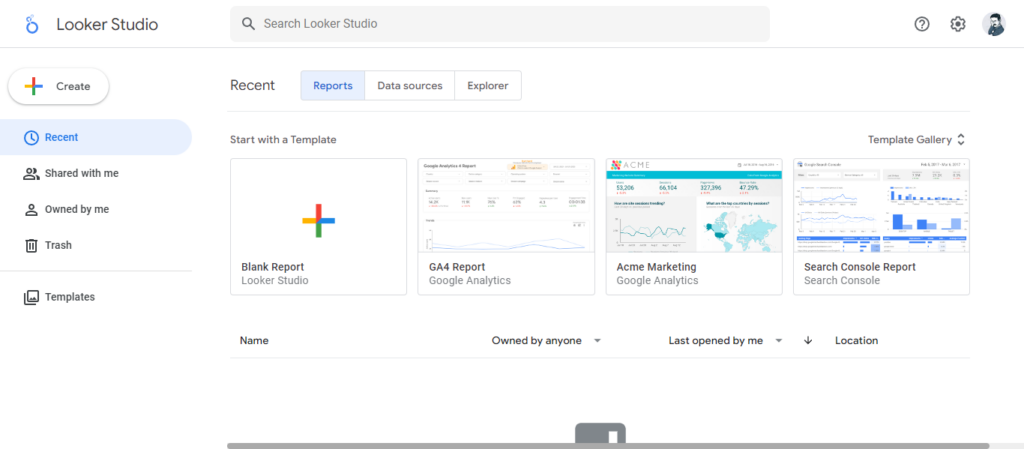
Looker Studio is a cloud-based BI and analytics platform that helps users create and share data-driven applications and dashboards.
Looker Studio offers a free plan supporting 5 users and 10 GB data storage. Users can also access dozens of data connectors, pre-built applications, and community resources.
Looker Studio is ideal for developers and data enthusiasts who want to build custom and scalable BI solutions. Looker Studio offers a 14-day free trial, and paid plans start at $48 per month.
Some of the key features of Looker Studio are:
- LookML: A declarative and modular language that lets users define data models, business logic, and data transformations.
- API: A RESTful API that lets users integrate Looker Studio with other applications and services.
- Embedding: A feature that lets users embed Looker Studio components such as charts, dashboards, and explorers into their website or application.
- Blocks: A feature that lets users reuse and combine pre-built data models, views, and applications from the Looker Studio library or community.
6. Metabase
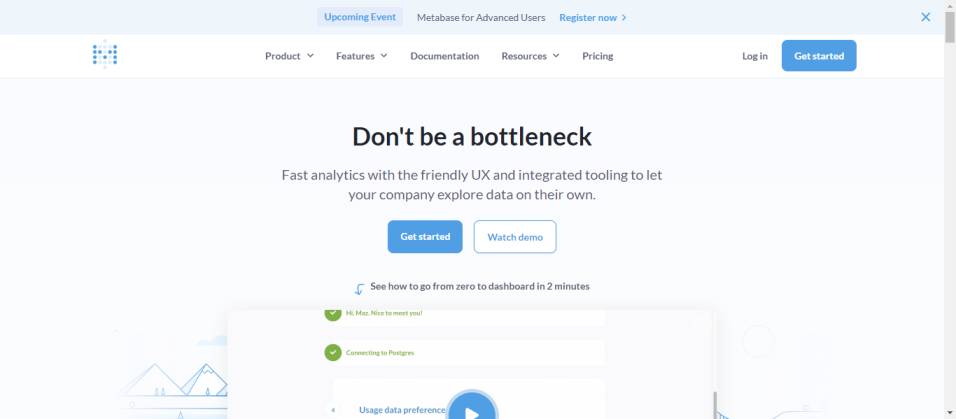
Metabase is an open source BI and analytics platform that helps users ask questions and get answers from their data.
Metabase is free to download and use, and can be deployed on a variety of platforms such as cloud, on-premise, or desktop. Users can access a wide range of data connectors, views and plugins.
Metabase is ideal for businesses that need a simple and easy-to-use BI solution.
Some of the key features of Metabase are:
- Query Builder: A tool that helps users create and execute data queries using a graphical interface or by writing SQL code.
- Data Explorer: A tool that helps users explore and analyze data by applying various filters, aggregations, and calculations.
- Dashboard Builder: A tool that helps users create and customize dashboards by adding and arranging various cards such as charts, tables, maps.
7. KNIME Analytics Platform
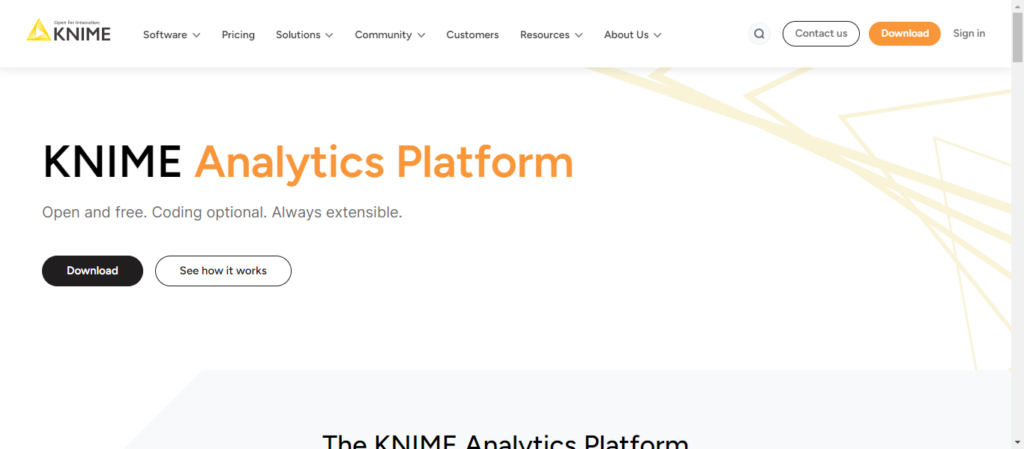
KNIME Analytics Platform is an open source data science and analytics platform that helps users build and run data workflows, from data access and preparation to modeling and deployment. The KNIME analytics platform is free to download and use, and can be extended with various plugins, extensions, and integrations. The KNIME Analytics Platform is suitable for data scientists and analysts who need a comprehensive and versatile data solution.
Some of the key features of the KNIME analytics platform are:
- Workflow Editor: which helps to create and run data workflows using graphical interface and drag-and-drop nodes.
- Node Repository: Helps to access and manage hundreds of nodes for various data operations including input/output, manipulation, analysis, visualization.
- KNIME Hub: helps discover and share data workflows, nodes, components, and extensions from the KNIME community.
- KNIME Server: Allows to deploy and manage data workflows on remote servers, and access them from any device or application.
- KNIME WebPortal: Allows to interact with and run data workflows through a web browser without installing the KNIME Analytics platform.
Conclusion
Free BI software can help businesses gain valuable insights from their data, without incurring huge expenses or compromising on quality. However, free BI software may have some limitations or trade-offs, depending on business needs and goals. Therefore, it is important to evaluate and compare different free BI software options before choosing one.
We hope this blog post helped you learn about the top 7 free BI software in 2024, and their features, functionality, and user reviews. If you have any questions or feedback, please don’t hesitate to leave a comment below. Thank you!
 Skip to content


