
Shocking Shooting at Salman Khan’s Home – You Won’t Believe Who’s Behind It!

Shocking Shooting at Salman Khan’s Home-The incident of massive firing at actor Salman Khan’s house in Mumbai has shocked everyone. ...
Read more
Indian student murdered in Canada: Car riddled with bullets, police searching for unknown assailants

Indian student murdered in Canada-A case of an Indian student being shot dead has come to light in Canada. The ...
Read more
Tired of Marketing Messages on WhatsApp? Here’s How to Say Goodbye

Tired of Marketing Messages on WhatsApp?-It is common to be troubled by marketing and promotional messages coming on WhatsApp. We ...
Read more
Android 15 Beta 1: Latest News and Revealed Features! Click Here to Find Out”

Android 15 Beta 1New Features-Recently, Google has introduced the next major update of its Android mobile operating system, Android 15 ...
Read more
What is mobile IMEI? How to find IMEI, need IMEI number
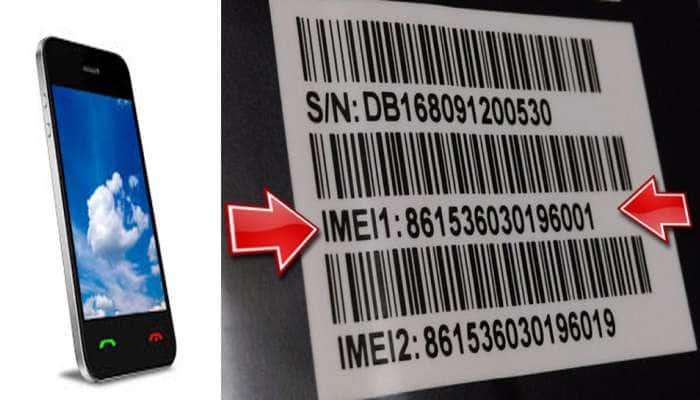
What is mobile IMEI? How to find IMEI, need IMEI number-Friends, in today’s article we are going to give all ...
Read more
Government Issues Urgent Security Warning: One Simple Mistake Could Compromise Your Device!
Government Issues Urgent Security Warning-As you all know that in today’s digital era, almost every work of ours depends on ...
Read more
Good news for Delhi NCR: Now DTC bus tickets can be booked through WhatsApp.

New facility launched by WhatsApp- People of Delhi NCR can now book DTC bus tickets through WhatsApp, this facility has ...
Read more